
Read the audit trail
Audit lives in two places: the Audit logs page of the portal, which shows each user their own calls, and the JSON lines that every component writes to its standard output, which you ship to your log system.
Audit logs in the portal
Section titled “Audit logs in the portal”The page Audit logs lists the tool calls of the signed-in user, newest first. It is the same for administrators: it shows only your own calls, and no argument values. To see what other users or other administrators did, use the log lines (next section).
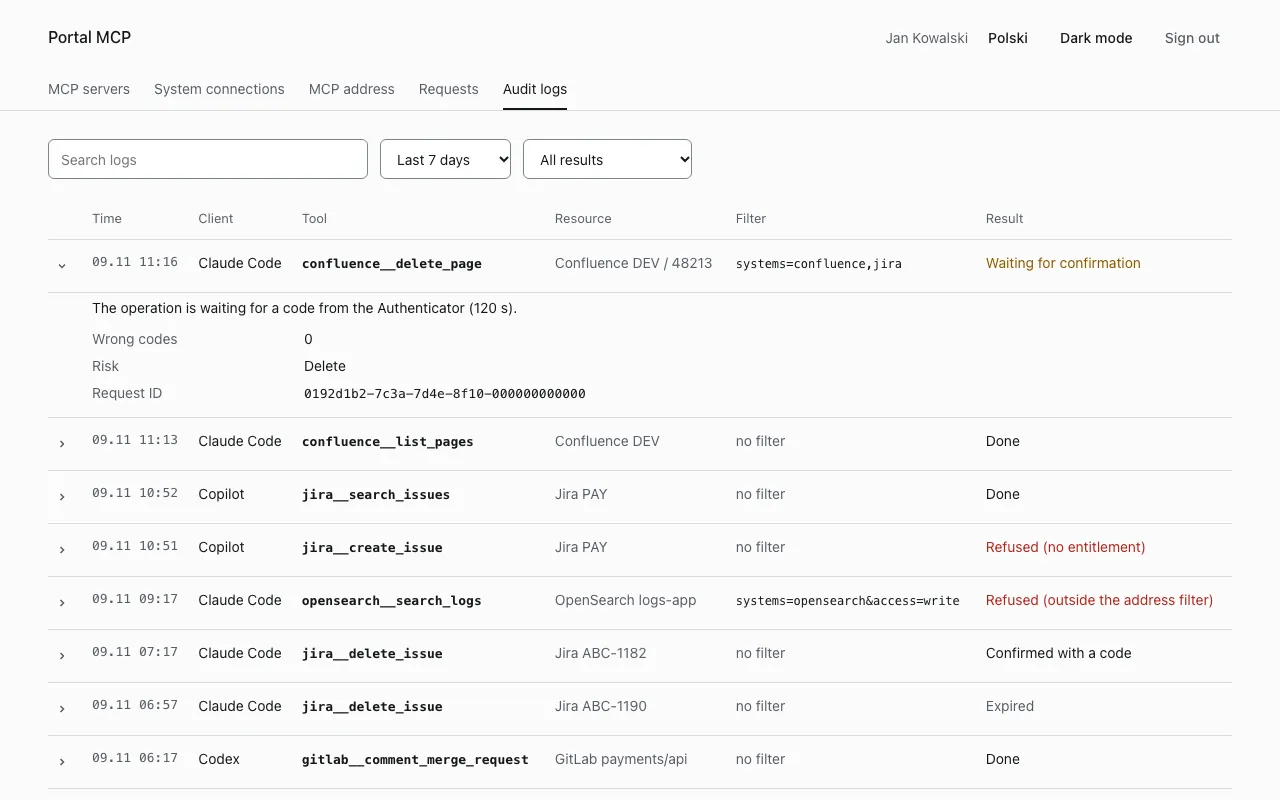
Filters: Search logs, the period (Last 24 hours, Last 7 days, Last 30 days) and the result group (All results, Completed, Refusals, Errors, Code confirmations). Columns: Time, Client, Tool, Resource, Filter (the filter of the /mcp address the client used) and Result. Expand a row for Wrong codes, Risk, Error code and the Request ID. A user gives you the request ID, and you trace the call with it.
Results you will meet:
| Result | Meaning |
|---|---|
| Done | The call went through |
| Refused (no entitlement) | The user has no group for the tool |
| Refused (outside the address filter) | The user has the entitlement, but the address the client used excludes the tool |
| Refused (policy) | A policy or an override forbids the call |
| Tool switched off | An emergency switch is on, or the tool is not approved |
| No connection to the system | The user has not connected the account |
| Too many calls | Rate limit |
| Identity confirmation required | The call needs a fresh MFA |
| Waiting for confirmation, Confirmed with a code, Expired, Wrong code, Invalidated, Cancelled, Blocked by a pending operation | The stages of a call with the risk Delete, which needs a code from the Authenticator (120 seconds, 3 attempts) |
The gateway keeps this activity for 30 days by default. The setting belongs to the gateway.
Audit lines in the logs
Section titled “Audit lines in the logs”Every component writes one JSON line per event to standard output. The gateway and the broker use the logger AUDIT. The portal and the servers use pl.aiwcorpo.mcp.audit. All lines of one call share the requestId. The platform only writes: retention and search are those of your log system.
With the Compose bundle, take the lines from the containers:
docker compose logs gateway mcp-credential-broker portal | grep <request-id>A normal call leaves these lines:
| Component | Event | Tells you |
|---|---|---|
| gateway | policy_decision |
Allowed or refused, with the reason and the policy revision |
| gateway | credential_resolve |
The credential type obtained from the broker and the outcome |
| broker | credential_resolve |
The same call seen from the broker (server is the target system) |
| gateway | confirmation |
The stages of a call with the risk Delete |
| server | policy_decision, tool_call |
The decision on the resolved resource and the outcome |
| gateway | tool_call |
The final outcome and the latency |
Event types:
| Event | Written by | Records |
|---|---|---|
tool_call |
gateway, servers | The outcome of one call |
policy_decision |
gateway, servers | An authorization decision |
credential_resolve |
gateway, broker | Obtaining a credential |
connection_change |
broker, portal | Create, replace, refresh or delete of a user’s connection, with backendUser, the account in the target system |
confirmation |
gateway | Stages of a confirmation with a code |
authenticator |
broker, portal | Registration, codes, locks |
admin_change |
gateway, broker, portal | Administration changes |
authentication |
gateway, broker, servers | A refused token or a rejected client certificate |
Each line has ts, requestId, component, componentId, event, outcome (ok, error, denied) and, where they apply, sub, username, client, server, tool, risk, resource, decision, reason, policyRevision, credentialType, errorCode and latencyMs.
What administration changes record
Section titled “What administration changes record”admin_change carries the sub of the administrator and a reason:
| Change | reason |
|---|---|
| Server added, changed, removed | server_created, server_updated (with changedFields, never values), server_deleted |
| Connection approved or proposed | server_connection_approved, server_connection_changed, with tlsMode and the fingerprint |
| Policies | policies_submitted, policies_approved, policies_changed |
| Tool definition | definition_submitted, definition_approved (with definitionHash, and risk and action for a classification), risk_lowered_by_admin |
| Scope mapping | scope_mapping_changed, scope_mapping_entry_removed, scope_mapping_entry_ignored |
| Override | override_set, override_removed, override_invalid, override_rejected (with overrideId, overrideTarget and the SHA-256 of the text, never the text) |
| Emergency switch | kill_switch_set, kill_switch_cleared |
| System | system_created, system_updated, system_deleted, connections_invalidated |
What is never recorded
Section titled “What is never recorded”Argument values, tool results, secrets, tokens, confirmation codes, TOTP seeds and the text of a switch reason never appear in a line. The line has argsLength, the length of the arguments, and nothing else about them. Control characters, U+2028 and U+2029 are escaped in every value.
Repeated refusals of the same kind (an invalid filter, a call refused for lack of rights) are written at most once per user, reason and target every 10 seconds. A summary event with suppressedCount follows. The refusal itself always works. Each instance keeps its own window, so two instances write up to one event each.
Alerts worth having
Section titled “Alerts worth having”| Signal | Why |
|---|---|
admin_change with kill_switch_set |
Someone switched a server or a tool off |
admin_change with risk_lowered_by_admin |
A risk was lowered |
admin_change with definition_approved |
Review who approved what, especially a definition from a running server |
admin_change with server_connection_approved |
A new fingerprint was trusted |
admin_change with override_set |
A forbid rule was added |
authentication events in a burst |
A component cannot verify tokens, or a client presents a bad certificate |
tool_call with rate_limited_user for one sub |
A runaway agent or a guessing attack |
authenticator with authenticator_disabled |
20 wrong codes: a guessing agent or a forgetful user |
The gauge mcp_gateway_kill_switches_unreadable equal to 1 |
The gateway cannot read the switches and refuses every call |
The complete list of fields and reasons is in the audit event schema of the contracts (see Contracts).